
Erlang’s virtual machine, BEAM, is incredibly stable. It’s not often that I see SIGSEGV or something more elaborate. But when it happens, what options do I have other than analysing code dump? How do I debug the BEAM itself, when I have a test case crashing the emulator?
Disclaimer: these are ERTS internals that may change without prior notice.
Building the DEBUG emulator
OTP is open sourced and available on GitHub. Clone the repository to your machine, configure and run the normal build first. The example above uses development branch. Run git tag to view release tags and pick one you need.
git clone https://github.com/erlang/otp
cd otp
git checkout master # git checkout OTP-24.3.2
export ERL_TOP=`pwd`
./configure
make -j
Proceed with the DEBUG flavour:
make -j -C erts/emulator debugRun the debug emulator to ensure it works:
$ERL_TOP/bin/cerl -emu_type debug
Erlang/OTP 25 [RELEASE CANDIDATE 2] [erts-12.3.1] [source-c62ad9bdc8] [64-bit] [smp:24:24] [ds:24:24:10] [async-threads:1] [jit:ns] [type-assertions] [debug-compiled] [lock-checking]

Eshell V12.3.1  (abort with ^G)
You can run emacs integrated with gdb using $ERL_TOP/bin/cerl -rgdb. To start the emulator, use the following command in a gdb window:
run -- -root $ROOTDIRFeel the power of emacs, gdb and humbly named Grand Unified Debugger. Beware… err, be aware of lldb that you can run with cerl -lldb.
Debug with VSCode

Grey-bearded kernel warriors may be happy with gdb+emacs. I found it less hardcore to use VSCode with this launch.json configuration (assuming Linux running on x86_64):
{
  "version": "0.2.0",
  "configurations": [
    {
      "name": "(gdb) Launch",
        "type": "cppdbg",
        "request": "launch",
        "program":
          "${workspaceFolder}/bin/x86_64-pc-linux-gnu/beam.debug.smp",
        "args": [
            "--", "-root", "${workspaceFolder}",
            "-bindir", "${workspaceFolder}/bin/x86_64-pc-linux-gnu"
        ],
        "cwd": "${workspaceFolder}",
        "environment": [{
          "name": "BINDIR",
          "value": "${workspaceFolder}/bin/x86_64-pc-linux-gnu"
        }],
        "MIMode": "gdb",
        "setupCommands": [
          {
            "description": "Load Erlang Pathologist Toolkit",
            "text": "-interpreter-exec console \"source -v ${workspaceRoot}/erts/etc/unix/etp-commands\"",
            "ignoreFailures": true
          }
        ]
    }
  ]
}
Let’s take a closer look. First is the executable name, beam.debug.smp. When I type erl, it spawns erlexec, which in turn spawns beam.smp (default), or beam.$EMU_TYPE.smp depending on the -emu_type argument. You can build multiple flavours, for example, lock-counting BEAM, or ASAN, and attach a debugger to it.
Second is BINDIR environment variable. It must be an absolute path pointing to the directory containing emulator binaries.
Last is the root directory. BEAM appends bin to it and looks for the boot script (start.boot by default). Note the -- separator preceding command line arguments. If you want to specify emulator flags, they need to go before the separator:
"args": ["-S", "4:4", "--", "-root", "${workspaceFolder}"],Note that emulator flags are prefixed with - and not + as one would expect.
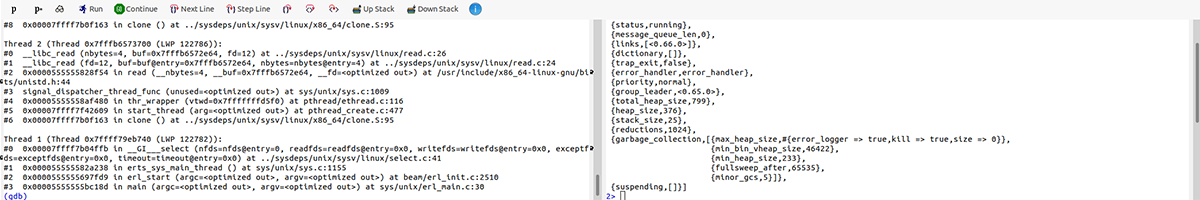
One more caveat, by default VSCode debug console interprets input as an evaluate command. Add -exec to all usual gdb commands to get the expected output. For example, use -exec etp-process-info c_p to print the process control block:

Running rebar3 with debug emulator
My development routine often requires running Common Test via rebar3. I find it very convenient to start with the test suite reproducing the problem. Which could be the BEAM dumping its core.

Create a new app with rebar3 by running rebar3 new myapp in $USER/erlang, then add a test suite to $USER/erlang/myapp/test/coredump_SUITE.erl:
-module(coredump_SUITE).
-export([all/0, basic/1]).

all() -> [basic].

basic(_Config) ->
    erlang:halt(abort).
The test case above produces core dump on purpose:
~/erlang/myapp# rebar3 ct --suite coredump_SUITE
===> Verifying dependencies...
===> Analyzing applications...
===> Compiling myapp
===> Running Common Test suites...
%%% coredump_SUITE: Aborted (core dumped)
Following incantation replacing relevant launch.json parts runs rebar3 with the debugger attached:
"args": [
  "-S", "4:4",
  "-B",
  "--", "-root", "${workspaceFolder}",
  "-home", "$HOME",
  "-boot", "no_dot_erlang", "-noshell",
  "-run", "escript", "start",
  "-extra", "/usr/local/bin/rebar3",
  "ct", "--suite", "coredump_SUITE"
],

"cwd": "/home/max-au/erlang/myapp",
Highlighted options:
- -B disables built-in break handler (see +B d documentation)
- -home points at the user home directory (rebar3 wants to read global configuration and a few more things there)
- -run escript start does the actual magic calling
escript:startmethod - -extra works as a second separator, forwarding remaining arguments to escript:start/1.
Long story short, this command line makes BEAM to call
escript:start(["/usr/local/bin/rebar3", "ct",
  "--suite", "coredump_SUITE"]).
rebar3 works in the current directory context, hence it must be supplied in the launch configuration.
Running rebar3 with gdb
When VSCode is not available, same settings can be used to debug with gdb:
~/erlang/otp# gdb bin/x86_64-pc-linux-gnu/beam.debug.smp
(gdb) cd ~/erlang/myapp
(gdb) set env BINDIR /home/max-au/erlang/otp/bin/x86_64-pc-linux-gnu
(gdb) run -S 4:4 -B -- -root $ERL_TOP -home $HOME -boot no_dot_erlang -noshell -run escript start -extra /usr/local/bin/rebar3 ct --suite coredump_SUITE
This code changes current working directory to the myapp project location, then sets BINDIR variable, which must contain absolute path – adjust it for your system.
Learning more
While the techniques above helped me to find and fix some fancy issues in the past, it might not be the only way. It may not be the best one either. I am interested in learning more powerful techniques. If you happened to know one, please, share it with the Erlang community.
Great post! Thank you for sharing it :).
I tried to run the debugger in Visual Code with your launch.json example but I was getting `{“init terminating in do_boot”,no_or_multiple_bindir_variables}`. After doing some debugging, I found that it wasn’t reading BINDIR environment variable so I fixed by adding it to `”args”` ( `”args”: [“–“, “-root”, “${workspaceFolder}”, “-bindir”, “${workspaceFolder}/bin/x86_64-pc-linux-gnu”]` for anyone having the same problem as me)